Postcone
Good, cheap, fast (enough) analytics
You have data
// let's say you manage an API,
// your data might look like this
{
    "request": {
        "path": "/v1/users/login",
        "method": "POST",
        "size_kb": 0.167,
    },
    "response": {
        "duration_ms": 250,
        "status": 200,
        "size_kb": 0.086
    },
}
You want to keep track of it
You'd like a chart that looks like this
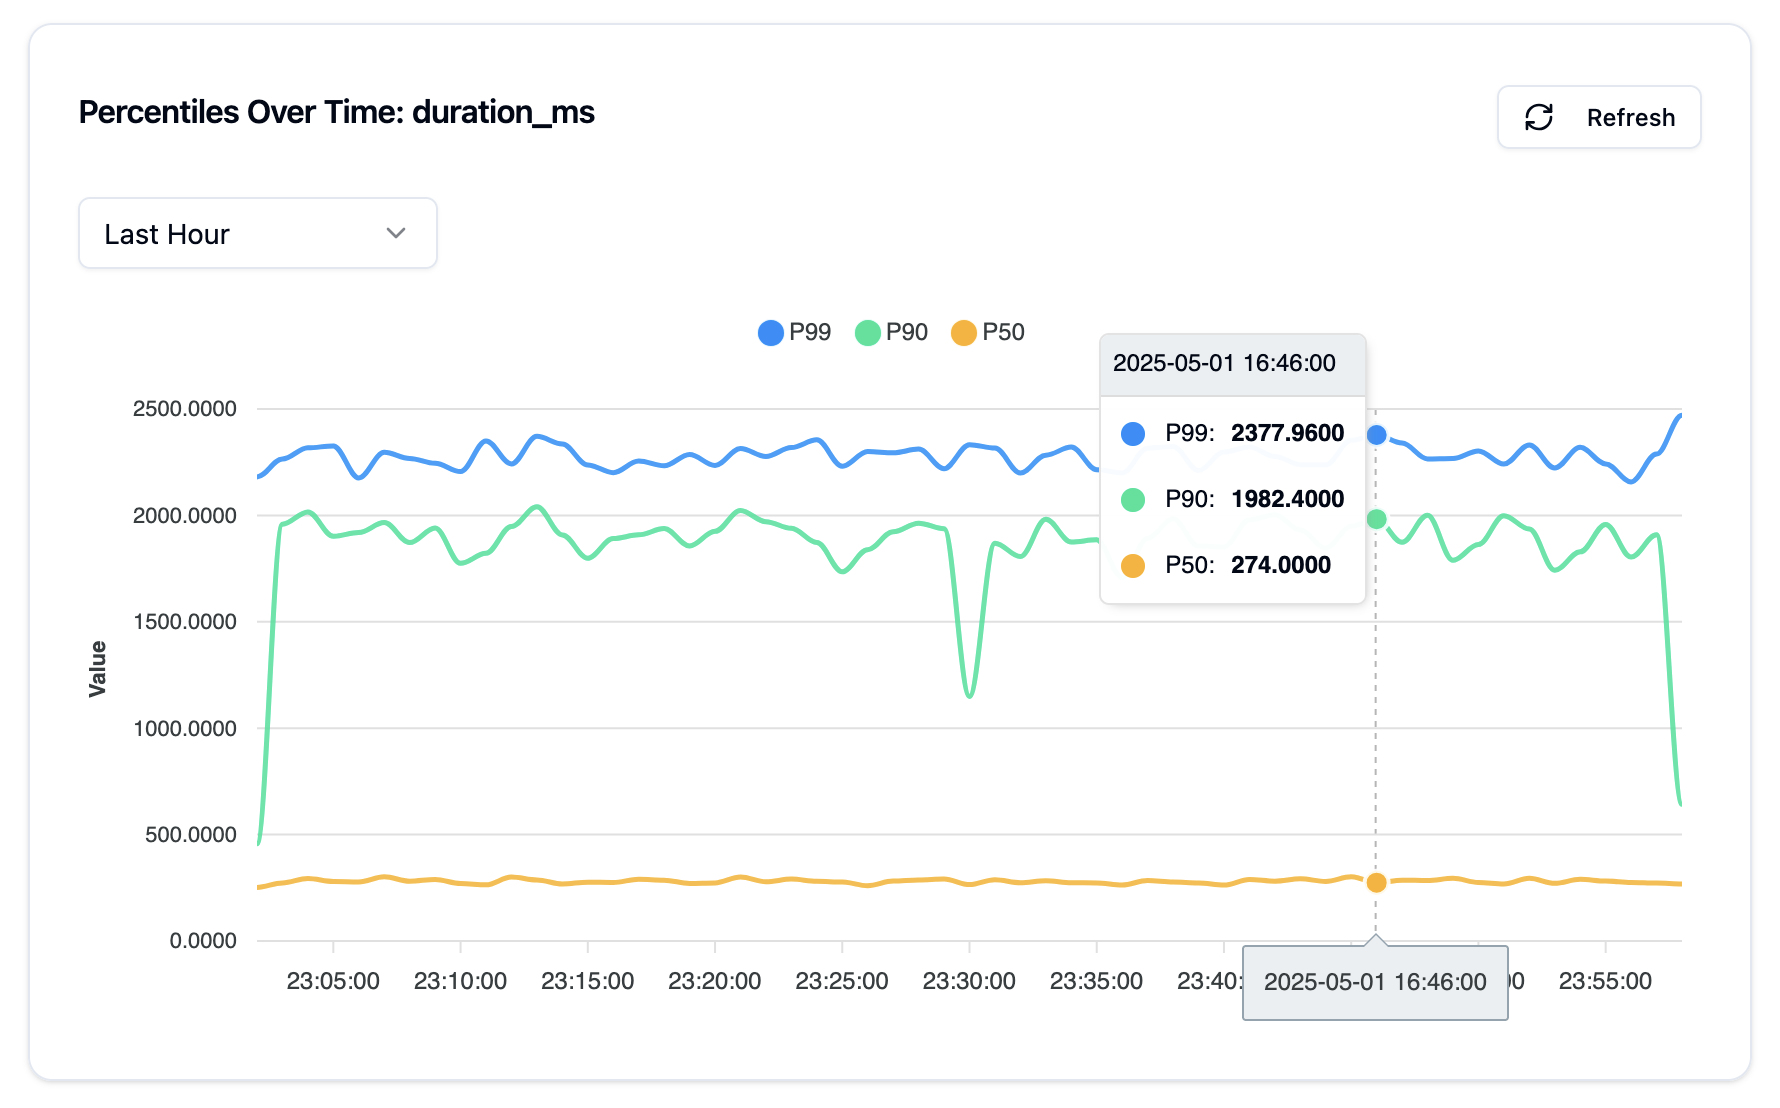
And you'd like to not have to set it up yourself, for every field you want to monitor.
Postcone solves this
All it takes is an API key and a few lines of code.
Here's what it looks like:
postcone = Postcone(api_key="...")
table = postcone.getTable("api_requests")
your_data = {
  ...all that good stuff...
}
table.send(your_data)
That's it.
And a few minutes later, your data will be visible/queryable.
Pricing
tl;dr: $10/month base access + usage
Membership in the cone: $10/month
Usage-based pricing
| Service | Unit | Price |
|---|---|---|
| Compute | per hour | $0.25 |
| Storage | per TB / month | $25.00 |
| Class A ops / million | $5.00 | |
| Class B ops / million | $0.50 | |
| Bandwidth | per TB (ingress/egress) | $5.00 |